Building an Observability Platform From Scratch
Building an Observability Platform From Scratch
When I joined the cloud ops team at Parkar, "monitoring" meant a handful of scattered cron jobs, a Slack channel nobody fully trusted, and institutional knowledge that lived in two people's heads. When something broke, the first ten minutes of every incident went to answering one question: is this actually broken, or is it just noisy? That question alone was costing us more than most of the outages themselves.
Eighteen months later, we run a stack that's cut MTTR by roughly 40% and removed 15–20 hours a week of manual operational work. None of it needed a six-figure observability budget. Here's how it's built, and what I'd do differently if I started over.
The Constraints That Shaped the Design
Before picking tools, I wrote down what we actually had to work with:
- A mixed fleet — production workloads on AWS and Azure, plus a chunk of internal infrastructure still running on Proxmox VMs
- No budget for a SaaS observability platform across the whole fleet
- A small team, so anything we built had to be maintainable by one or two people, not a dedicated platform org
- Existing Ansible playbooks for provisioning — agent rollout had to slot into that workflow, not replace it
Those constraints ruled out most of the "obvious" answers. A fully managed stack everywhere was too expensive; a pure Prometheus/Alertmanager setup meant owning exporters and long-term storage ourselves with no spare headcount. We landed on Zabbix for collection and alerting, Grafana for visualization, with Datadog layered in only where a specific client environment needed it.
The Shape of the Stack
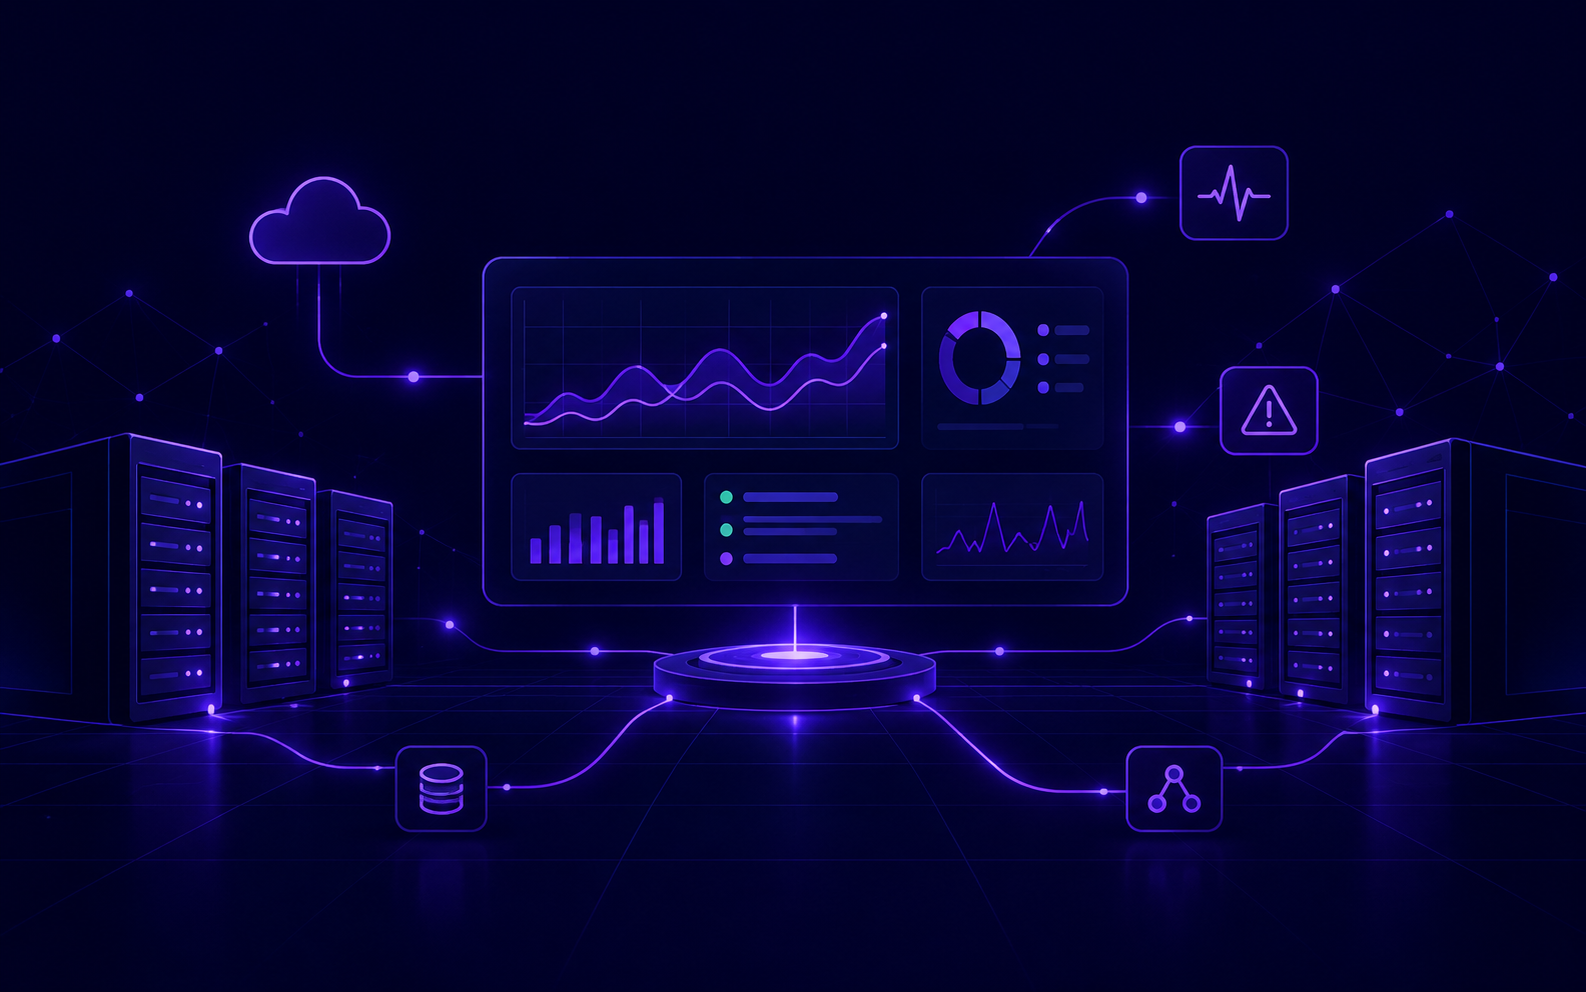
A Zabbix server sits at the center, with proxies per environment so agents never talk to the server directly across a WAN link. Every host gets its agent rolled out the same way everything else gets provisioned — as an Ansible role, registered against the Zabbix API the moment the host comes up:
# roles/zabbix_agent/tasks/main.yml
- name: Install Zabbix agent
  package:
    name: zabbix-agent2
    state: present

- name: Deploy agent config from template
  template:
    src: zabbix_agent2.conf.j2
    dest: /etc/zabbix/zabbix_agent2.conf
  notify: restart zabbix-agent2

- name: Register host in Zabbix via API
  community.zabbix.zabbix_host:
    host_name: "{{ inventory_hostname }}"
    host_groups: "{{ zabbix_host_groups }}"
    link_templates: "{{ zabbix_templates }}"
    status: enabled
  delegate_to: localhost
Host groups map to service ownership, not infrastructure type — "payments-prod" and "payments-staging" rather than "linux-servers." That single decision made almost every dashboard and alert downstream easier to reason about, because the grouping already answers "who owns this" before anyone opens Grafana.
Grafana sits on top, reading Zabbix as a data source. Zabbix stays the system of record for collection and alerting; Grafana is purely the human-facing layer, which keeps us from duplicating alert logic in two places.
Stopping Alert Storms Before They Start
The fastest way to lose a team's trust in monitoring is to page them ten times for one outage. If a host goes down, every service on it doesn't need its own page — they need one page, with everything else visible as context.
Zabbix trigger dependencies solve this directly: a child trigger (service down) depends on a parent trigger (host unreachable), and Zabbix suppresses the child alert while the parent is active.
Parent trigger:  last(/{HOST.HOST}/icmpping)=0        → "Host unreachable"
Child trigger:   last(/{HOST.HOST}/proc.num[nginx])=0  → "nginx not running"

Triggers → nginx-not-running → Dependencies → add "Host unreachable"
# Result: one page for the host outage, not one per affected service
We built this into every new host template as a required step, not an afterthought — dependency chains are cheap to define up front and expensive to retrofit once a system is already noisy.
The Feature That Actually Moved the Needle
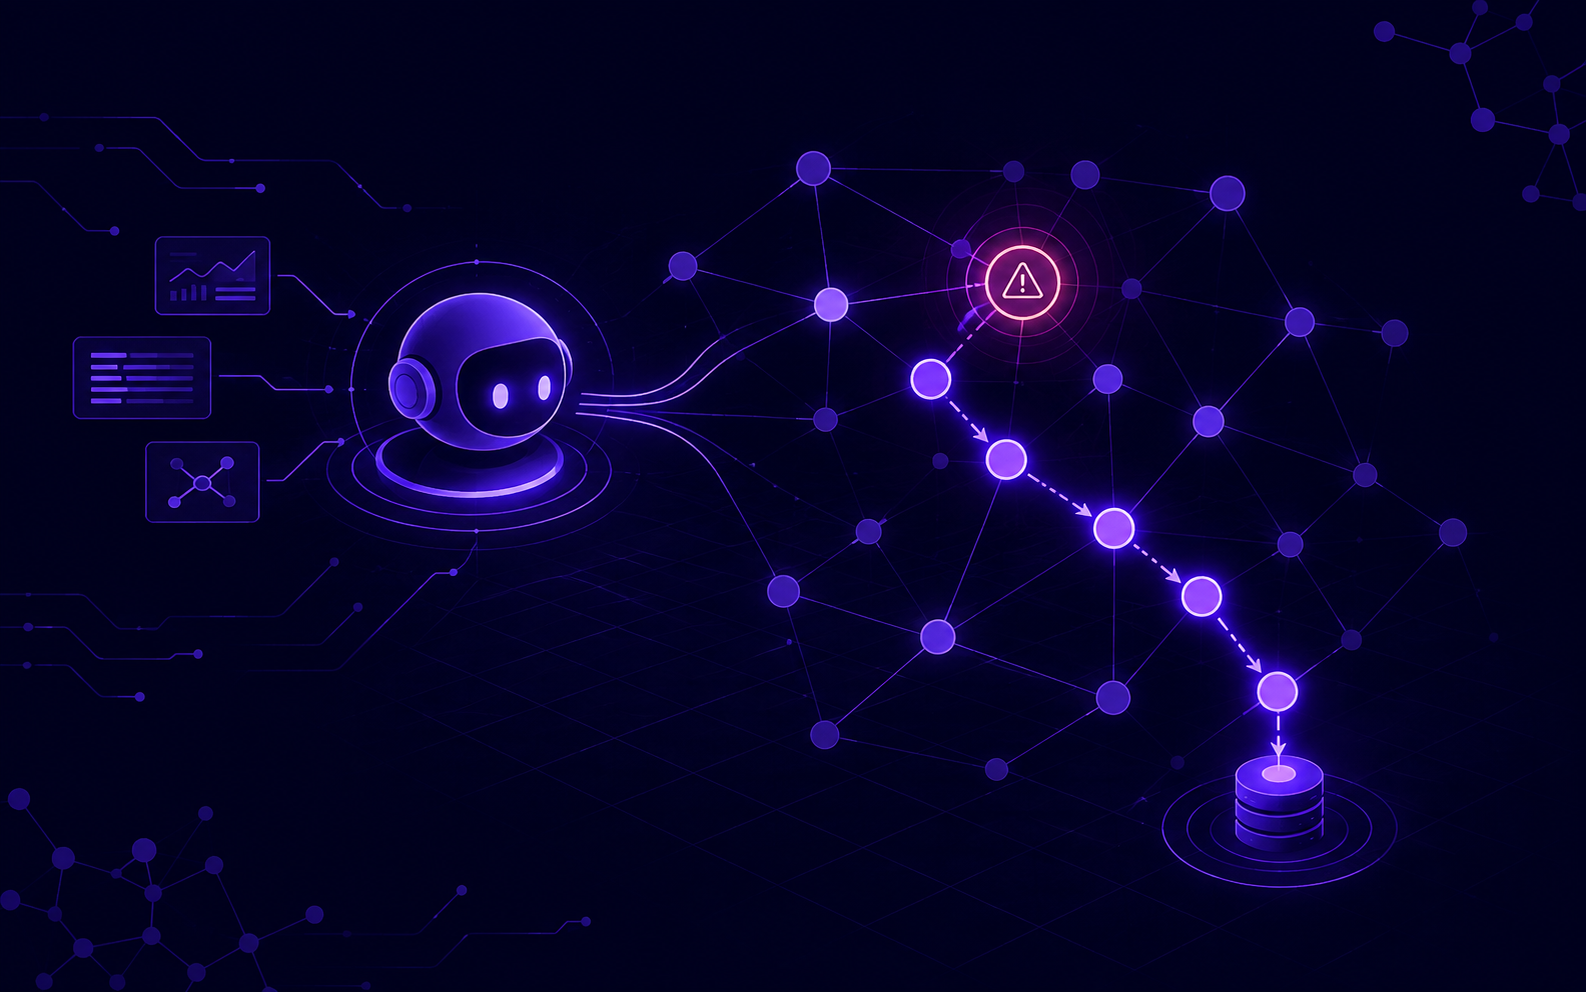
Trigger dependencies stopped the noise. The bigger win was automating what happens the moment a real alert fires. Instead of an engineer SSHing in at 2 AM to gather context by hand, a script runs automatically and attaches a preliminary investigation report to the incident before anyone's even opened their laptop:
def build_investigation_report(alert: dict) -> dict:
    """Runs automatically when an alert fires, before a human looks at it."""
    host = alert["host"]
    report = {
        "alert": alert["name"],
        "host": host,
        "recent_metrics": get_metric_history(host, minutes=30),
        "recent_deploys": get_deploy_events(host, hours=2),
        "dependent_services": get_dependent_service_status(host),
        "recent_log_errors": tail_error_logs(host, lines=200),
    }
    post_to_incident_channel(alert["incident_id"], format_report(report))
    return report
By the time the on-call engineer opens the incident channel, they already have the last 30 minutes of metrics, whether a deploy went out recently, and the top error lines — the exact questions that used to eat the first ten minutes of every incident. That one change cut manual investigation time by about 90%.
What Broke Along the Way
- Over-alerting in month one. Everything got a trigger, and by week three the on-call channel was unreadable. The fix: every new trigger now needs a linked runbook before it can go live — no runbook, no page.
- Template sprawl. Cloned templates diverged silently over months. We consolidated down to a small shared template library with macros for host-specific overrides instead of one-off copies.
- Documentation debt. A dashboard without context is just pretty noise. Every Grafana dashboard now links back to its owning runbook and the triggers that feed it.
Where It's Going Next
Datadog is rolling out to more client environments where the budget makes sense, and — per my last post — eventually the same instinct extends into a Kubernetes cluster once we're actually running one in production. The tools change; the discipline underneath doesn't.
If You're Starting From Zero
- [ ] Write down your constraints — budget, team size, existing tooling — before picking a stack
- [ ] Every alert needs an owner and a runbook link before it goes live
- [ ] Build dependency chains early; they're cheap now, expensive to retrofit into a noisy system
- [ ] Automate the diagnostic legwork, not just the paging
- [ ] Review your alert-to-actionable ratio monthly and prune aggressively
Observability isn't a tool you buy. It's a discipline you build, one alert and one automated check at a time.